

Table of Contents
Introduction
Client-side Setup
VS Code configuration
Debugging standalone java application
Debugging an application running in Pathway environment
Conclusion
Introduction
Visual Studio Code (VS Code) is a lightweight, extensible source code editor developed by Microsoft. It provides a powerful environment for coding, building, and debugging applications across multiple programming languages.
This document outlines the steps required to debug Java applications running on HPE Nonstop systems using VS Code (GUI). It includes instructions for vs code installation, configuration, and client-side setup to ensure a smooth debugging experience.
Client-side Setup
Install Visual Studio Code and configure it with the necessary extensions for Java development and debugging.
- Install Visual Studio Code
Download and install the latest version of Visual Studio Code.
- Install Required Extensions
Install the following VS Code extensions to enable Java development:
- Extension Pack for Java by Microsoft
This pack includes essential extensions such as:- Language Support for Java™ by Red Hat
- Debugger for Java
- Java Test Runner
- Maven for Java
- Visual Studio IntelliCode
You can find and install this pack from the Extensions view (Ctrl+Shift+X) by searching for “Extension Pack for Java”
VS Code configuration
To enable remote debugging of a Java application running on a Nonstop system, you need to create a launch configuration in VS Code.
- Create a Launch Configuration
-
- Open your project in VS Code.
- Navigate to the Run and Debug view (Ctrl+Shift+D).
- Click on “create a launch.json file” if one does not already exist.
- Choose Java as the environment.
- Replace or add the following configuration in the launch.json file:
{
"version": "0.2.0",
"configurations": [
{
"type": "java",
"name": "Debug (Attach) - Remote",
"request": "attach",
"hostName": "10.132.236.28",// replace with your Nonstop host
"port": 8000, // replace with appropriate debug port
"projectName": "vscode"
}
]
}
Debugging standalone java application
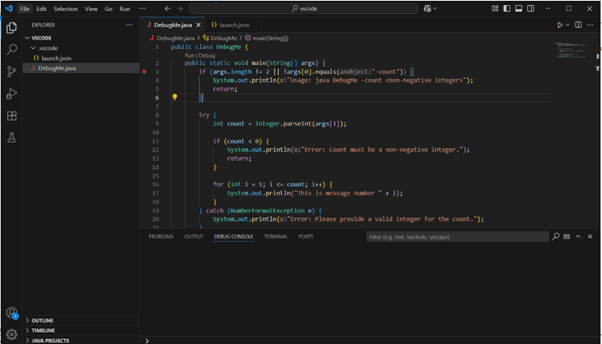
DebugMe.java is a simple Java command-line program that prints a sequence of messages based on a user-specified count. It accepts the argument in the format -count <int>.
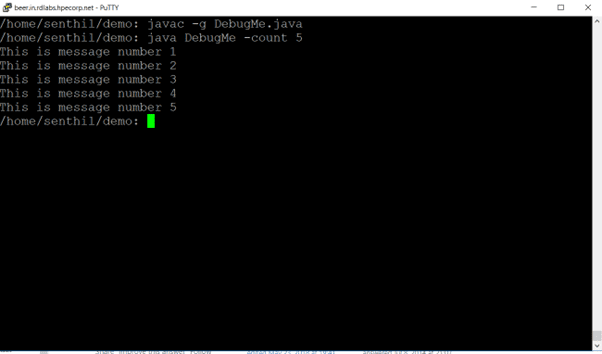
To compile this program on Nonstop, execute the following command:
javac -g DebugMe.java
To Run this program on Nonstop, execute the following command:
java DebugMe -count 5
To debug the DebugMe program using VS Code, start the Java application on the Nonstop system with the following command
java -cp .: -agentlib:jdwp=server=y,transport=dt_socket,address=8000 DebugMe -count 10
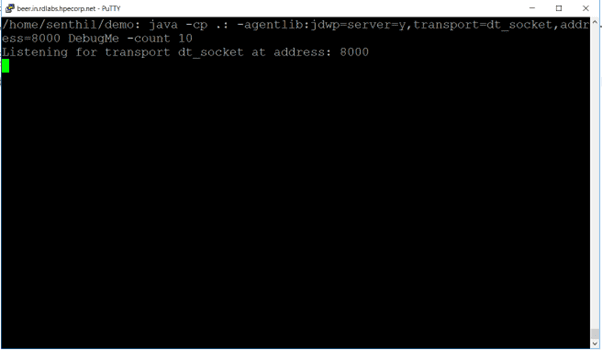
parameters passed:
agentlib:runjdwp: Enables the Java Debug Wire Protocol (JDWP), which allows remote debugging
transport=dt_socket: Specifies that the debugger should use a socket-based (TCP/IP) transport mechanism.server=y: Configures the JVM to act as a debug server, waiting for a debugger (like VS Code) to attach.address=8000: Sets the TCP/IP port on which the JVM listens for debugger connections. You can change this port if needed, but make sure it matches the port specified in your VS Codelaunch.json
To begin debugging your Java application:
- Open your project in Visual Studio Code.
- Go to the Run menu and select Start Debugging.
- Alternatively, you can press F5 to launch the debugger directly.
Once the debugger successfully attaches to the remote Java application, you will see the following screen
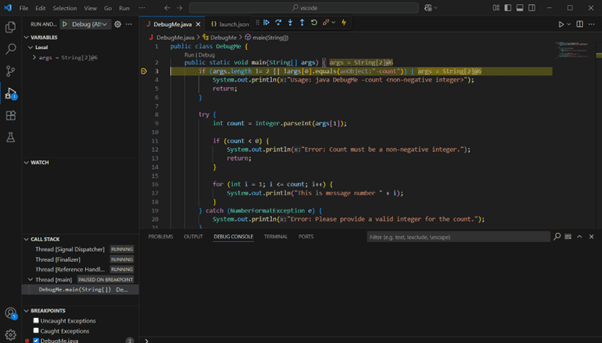
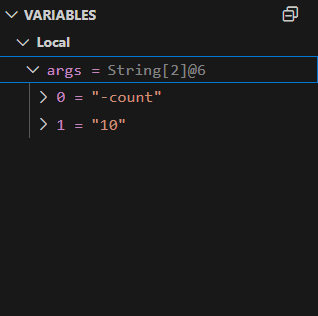
Variables view allows you to look at the content of the variables.
 Debug controls which appear on the top of the screen, allow you to step-in, step-out and resume.

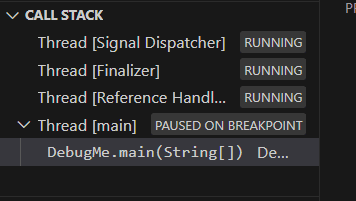
Few other views on the left side panels are watch, breakpoint and call stack.
Additional debug view can be opened using file menu “view” and click “open view”.
Debugging an application running in Pathway environment
You can debug a TS/MP Serverclass application in the same way as described for standalone Java applications. However, in the case of Pathway-managed serverclasses, the debugging options must be integrated into the serverclass configuration as below
SET SERVER AUTORESTART 3;
SET SERVER CREATEDELAY 3 SECS;
SET SERVER DEBUG OFF;
SET SERVER LINKDEPTH 1;
SET SERVER MAXSERVERS 1;
SET SERVER NUMSTATIC 1;
SET SERVER MAXLINKS 4;
SET SERVER PRI 138;
SET SERVER TMF OFF;
SET SERVER DELETEDELAY 10 MINS;
SET SERVER PROCESSTYPE OSS;
set server cwd /home/senthil/demo
set server env classpath=/home/senthil/demo:.:
SET SERVER ARGLIST "-agentlib:jdwp=server=y,transport=dt_socket,address=8000", &
"JavaHelloServer",&
"10.132.236.28",&
"7110"
SET SERVER PROGRAM /usr/tandem/nssjava/jdk180_l80/bin/java
set server STDERR /home/senthil/demo/demo.log
set server STDOUT /home/senthil/demo/demo.std.out
maxservers 1andnumstatic 1
These values are set to 1 to ensure that only a single instance of the serverclass runs. This guarantees that the debugger attaches to the correct process.
- Adding debug option in ARGLIST attribute “
-agentlib:jdwp=server=y,transport=dt_socket,address=8000” same as standalone java program - Application
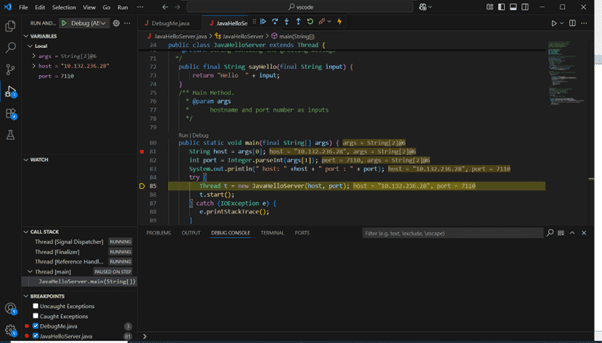
JavaHelloServer is a simple multithreaded server application written in Java. It listens for client connections, receives a string, and responds with a greeting message.
To begin debugging your Java application:
- Open your project in Visual Studio Code.
- Go to the Run menu and select Start Debugging.
- Alternatively, you can press F5 to launch the debugger directly.
After the debugger successfully attaches to the remote Java application, you will see the following screen
 Conclusion
This article briefly described a method to use GUI-based debugging of Java applications running on HPE Nonstop systems using Microsoft Visual Studio Code. By leveraging VS Code’s intuitive interface and built-in debugging tools.
- Microsoft, Visual Studio, and Visual Studio Code are trademarks or registered trademarks of Microsoft Corporation in the United States and/or other countries.
- Java is a registered trademark of Oracle and/or its affiliates
- Language Support for Java™ by Red Hat is a Visual Studio Code extension developed by Red Hat, Inc.
© Copyright 2025 Hewlett Packard Enterprise Development Company, L.P.

Be the first to comment