

Reducing Replication and Application Latency
One of the most critical aspects of data replication performance is latency, and the two most important types are replication latency and application latency.
Replication Latency
Replication latency is the elapsed time between when a data change (e.g., insert, update, delete) is committed to the source system database, and when it is applied to the target database. It is the time period when the change data is in the replication pipeline, and is affected by such things as system utilization, process priorities, and network bandwidth. This time period is very important because it represents production change data that is at risk – it is not yet backed-up, and may be lost in the event of an outage of the source or target system. The longer this time interval, the more data may be lost.1
Recovery Point Objective (RPO)
For this reason, companies typically assign a value for this metric, also known as the RPO, a time period which the replication latency cannot exceed in order to minimize data loss and meet required Service Level Agreements (SLAs). In general, there is a trade-off between replication latency and replication efficiency; the better (lower) the replication latency, the greater the replication overhead (increased system utilization), and vice versa.
Application Latency
Application latency is primarily applicable when using synchronous replication. When the source application calls transaction commit to make its data changes permanent, the synchronous replication software must ensure that the data changes are safe-stored on the target system (either in memory, in a queue file, or in the target database, depending on the configuration), before allowing the source transaction to commit (if not, then the source transaction outcome depends upon the configuration).2 In this way, synchronous replication software ensures that no committed data will be lost in the event of a source system outage (RPO = 0). However, a consequence of this process is that the time taken for the source application’s transaction commit to complete may be extended. This additional commit time is known as the application latency.3
The potential impacts of increased application latency include increased transaction response times, source record lock duration, the number of concurrent transactions, and system utilization. For these reasons, when using synchronous replication, application latency SLA specifications must be set which should not be exceeded.
In order to help ensure SLA metrics for both replication and application latency are being met, as well as raising alerts when they are not, replication software includes various options to control, monitor, notify, and set alarms for these metrics at various points during the replication process.
Managing Replication Latency
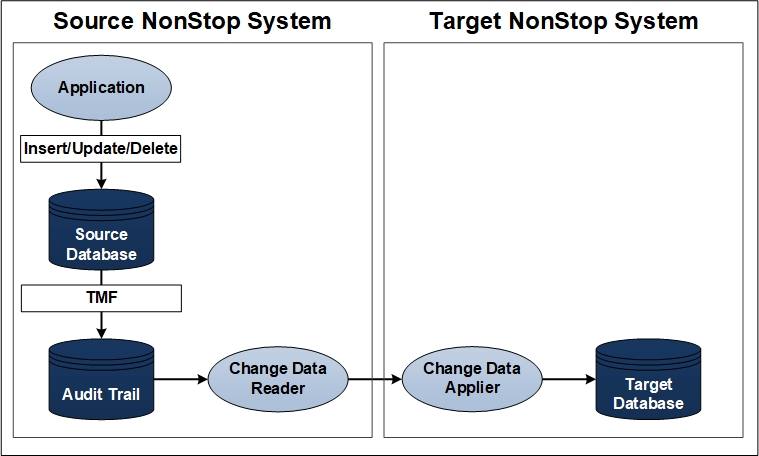
Figure 1 – Typical HPE NonStop Server Active/Passive Data Replication Configuration
Figure 1 shows a typical active/passive HPE NonStop Server source and target data replication configuration.4 On the active system, the Source NonStop, an application makes changes to a source database table/file (Enscribe, SQL/MP, SQL/MX). These changes are committed to the database via the TMF audit trail, and the “Change Data Reader” (CDR) process reads these changes from the audit trail and sends them across the network to the target system (using either Expand or TCP/IP communication).
On the passive system, the Target NonStop, the “Change Data Applier” (CDA) process receives these changes, acknowledges receipt of the message back to the CDR, and applies the changes into the target database. Replication latency is represented by the time between the data changes appearing in the TMF audit trail on the source system and their application into the database on the target system.5
To monitor this replication latency, it is possible to set latency threshold values for both the CDR and CDA processes. If the latency of either process falls outside of these values, warning messages may be issued. Latency threshold values should therefore be set equivalent to the desired maximum replication latency. When such latency threshold warnings are triggered, it is then possible to drill-down further to determine the cause of the situation and resolve it (e.g., how long the lagging condition has been present, and how far behind).
Calculating Source-side and Target-side Replication Latencies
The overall replication latency is a product of both the latency on the source (CDR) side, and on the target (CDA) side. Advanced data-replication software may offer facilities to determine these source and target replication latencies independently, as well as overall.
A possible method for calculating source-side replication latency:
- The CDR reads the TMF audit trail and saves the timestamp of the oldest read event.
- The CDR sends the data change messages to the CDA; all messages not subsequently acknowledged by the CDA are marked “in-flight.”
- Periodically, the CDR compares the oldest event timestamp of all the “in-flight” messages to the current system clock.6
- If the time difference is greater than the CDR’s latency threshold value, a “CDR is behind” message may be issued periodically until the CDR is back below its latency threshold.
A possible method for calculating target-side replication latency:
- The CDA receives the timestamp of each event in the messages from the CDR.
- After the CDA processes an event it compares the timestamp of the event to the current system clock.
- If the difference is greater than the CDA’s latency threshold value, a “CDA is behind” message may be issued periodically until the CDA is back below its latency threshold.
“Pulse” Mechanism
Some data replication software may also include a “pulse” mechanism to measure end-to-end replication latency, assisting those customers that need to adhere to a strict SLA. This mechanism is used to measure the amount of time that an inserted “pulse” record takes to traverse from the source database, through the replication process, to the target database (just like a “regular” application database change). Results are returned to the source system allowing review of current and historical pulse timings. In addition, warning messages may be issued when a completed pulse event exceeds a pre-defined threshold value or times-out (i.e., no response is received).
Pulse records may be automatically generated based upon a pre-defined interval (e.g., every 60 seconds), and/or generated interactively on-demand via an operator command. Therefore, a pulse mechanism can be used as needed to verify that replication latency remains within limits.
If an unacceptable level of replication latency is detected which does not resolve, the data replication software may offer tuning and configuration parameters which can help lower it below the required threshold.
Managing Application Latency
As discussed above, synchronous replication also introduces the concept of application latency (as well as replication latency, which still applies).7 As is the case with replication latency, there is a trade-off between application latency and replication efficiency. While synchronous replication software may provide numerous optimizations and control parameters to minimize application latency, it still needs to be managed in order to ensure it does not significantly impact source application transaction response times and violate SLAs.
When moving to a synchronous replication environment, it is necessary to proceed in an incremental fashion, in order to assess and minimize the potential impact of application latency on the application, before putting the synchronous replication environment into production. The following series of steps suggest a possible approach.
Step One: Configure and tune an asynchronous replication environment
Before putting a synchronous environment into production, the first step is to configure an equivalent asynchronous replication environment and tune it for the expected normal and peak application loads.8 Next, run the environment in a special “synchronous monitor mode”9, where transactions are replicated asynchronously and no additional application latency is introduced; however, the transactions are tracked and monitored as if they were synchronous.
Statistics generated for these transactions may be collected and displayed, allowing the measurement of the potential impact of synchronous replication with minimal impact on current operations (“what-if analysis”). Using this approach, synchronous monitor mode obtains a close approximation of the potential application latency, without actually incurring any additional application latency.
Step Two: Specify synchronous replication only for necessary transactions
The second step to managing application latency is to only specify synchronous replication for those transactions that really need it. Not all data is created equal – the potential loss of some low-value data may be acceptable, whereas other data is highly valuable, and no loss can be tolerated. Synchronous replication may be configured for a specific subset of the total source replicated dataset (either by inclusion or exclusion), based on such things as application process pathname, process name, program name, or user name, thereby minimizing the impact of application latency to only the necessary transactions and data.
Step Three: Monitor Application Latency
Once synchronous replication is configured and put into production, application latency needs to be monitored to ensure it stays within acceptable limits. The synchronous replication software may provide configuration methods to manage (limit) application latency, for example:
- High and low parameters defining values for the maximum allowable measured latency before the synchronous replication software falls back to asynchronous replication mode (the high case), and to which the measured latency must fall before it reverts back to synchronous replication mode (the low case).
- Parameters defining the maximum length of time the synchronous replication software will wait before voting to commit the transaction (whether or not it has been safe-stored on the target system). This parameter limits the amount of delay contributed by synchronous replication towards application latency.10
The set values of these parameters depend upon customer-specific requirements. However, in general, the major consideration is between minimizing application latency and application response time, or ensuring that no data is lost in the event of a failure.
Additional Application Latency Management Mechanisms
In addition to these mechanisms to control application latency, synchronous replication software may provide other statistics to monitor and drill-down into what may be causing any occurrences of excessive application latency. For example:
- A user-supplied target maximum time taken for both phases of the transaction commit process to complete. The number of times this value is exceeded may be counted and reported.
- The average time taken for both phases of the transaction commit process to complete. This value roughly approximates to the application latency actually observed by the application.
- The minimum, maximum, and average time taken for the synchronous replication software to complete the first (prepare) phase of the transaction commit process. These values represent the amount by which the synchronous replication processing has contributed to the observed application latency.
If an unacceptable level of application latency is detected which does not resolve, the synchronous replication software may offer tuning and configuration parameters which can help lower it below the required threshold.
Summary
Managing latency is one of the most important aspects of configuring and operating a data replication environment. This article reviewed control and monitoring approaches to limit replication and application latency, and provide timely warnings when these latencies exceed desired SLA thresholds. In the case of application latency, advanced synchronous replication software provides methods to manage the trade-off between data loss and transaction response times, allowing the desired level of application RPO to be set – zero for data which must not be lost, or higher values when it is more important to maintain application services in the event synchronous replication cannot be assured.
1 In the case of an asynchronous active/active replication architecture, this time period also represents the time window when a data collision is possible if the same data record is concurrently changed on source and target systems. ↑
2 Synchronous replication software typically provides various options on how to proceed in the event that data cannot be replicated synchronously. ↑
3 While replication latency is a contributing factor towards application latency, it does not account for all of it. ↑
4 While the details may be different, the latency issues discussed herein are equally applicable to a heterogeneous replication environment involving other platforms and databases. ↑
5 Replication latency measures the time from when the I/O materializes in the audit trail (is made available to be replicated), not when the I/O was applied by the application into the source database. On an HPE NonStop system, TMF flushing of the change data from the data disk process is indeterminate and will vary, and the file system does not record nor save the actual time when the application executed the I/O. ↑
6 Because replication latency is measured using system clocks as a basis, it is recommended to utilize a universal time synchronization product to keep the clocks synchronized between source and target systems, thereby ensuring the accuracy of the latency calculations. ↑
7 Note that application latency exists even in an asynchronous replication environment, but it is not affected by it (asynchronous replication is decoupled from the source application’s transaction and does not participate in the transaction completion process). ↑
8 Synchronous replication is typically built upon an existing asynchronous replication infrastructure, so it is imperative to first create a well-tuned asynchronous replication environment. ↑
9 If supported by the synchronous replication software. ↑
10 Note that commitment processing occurs in parallel across all transaction participants (such as disk processes) – the synchronous replication software is just one participant. The time taken by each participant is not cumulative with respect to the total application latency observed by the application. Generally, the observed application latency is a function of the time taken by the transaction participant that takes the longest to complete its processing. ↑

Be the first to comment